
New tracking and SEO that feeds Google Ads
Videokliniken.se digitises VHS, MiniDV and Hi8 tapes. We rebuilt the tracking and tied the SEO work on the site to Google Ads. ROAS went up markedly and the cost per conversion went down.
Visit the site →Before
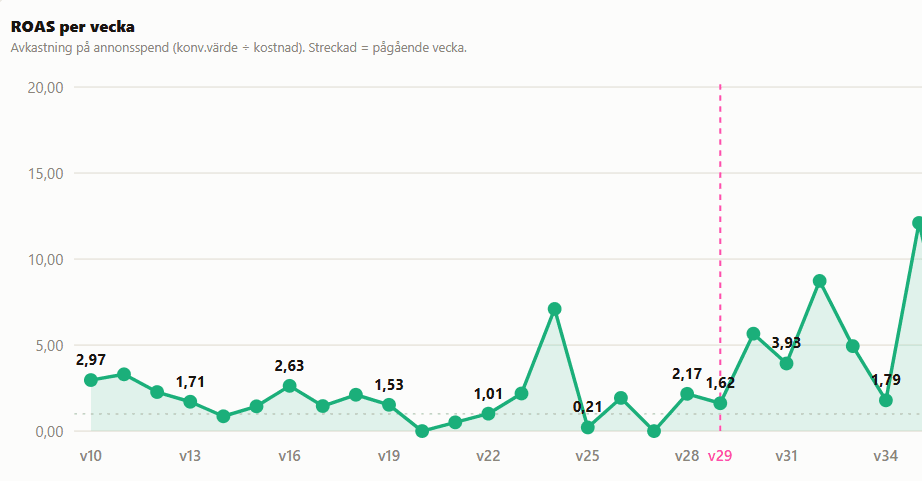
Videokliniken is Sebastian's own business, so here we test with our own money. The ads were running, but the return jumped between decent and outright loss. Several weeks ROAS was below 1, meaning more going out in ad spend than coming in as order value. The root problem was that Google Ads was not told enough about which clicks actually became orders and what they were worth. An ad engine optimising towards the wrong signal optimises wrong, however much you fiddle with the bids.
What was delivered
- Tracking rebuilt: the right conversions and the right value into Google Ads
- SEO work on the site tied to keywords and landing pages in Google Ads
- Markedly higher ROAS after week 29
- Lower cost per conversion
- Weekly ROAS follow-up
What we built
We started with the tracking. It was rebuilt so that Google Ads gets the right conversions with the right value back. Only then can the bidding chase the clicks that become business, rather than the ones that are merely cheap.
Then we tied the SEO work on the site to the ads. The same keyword work that makes the pages rank organically now decides which keywords we advertise on, and which page each ad lands on. When ad, keyword and landing page all say the same thing, the ad becomes more relevant. The click gets cheaper and the visitor lands in the right place straight away.
The chart shows the result. Before week 29, ROAS mostly sat between 1 and 3. Since then, five out of six weeks have been around 4 or higher, with peaks above 8. Individual weeks still swing, they always do in a small account. It is the level that has moved. Over the same period the cost per conversion has come down.
How it looks
Services in this case